Visualization techniques transform complex simulation data into actionable insights, particularly in ember drift modeling where precision determines success in fire behavior prediction and management.
🔥 Understanding Ember Drift Simulation Fundamentals
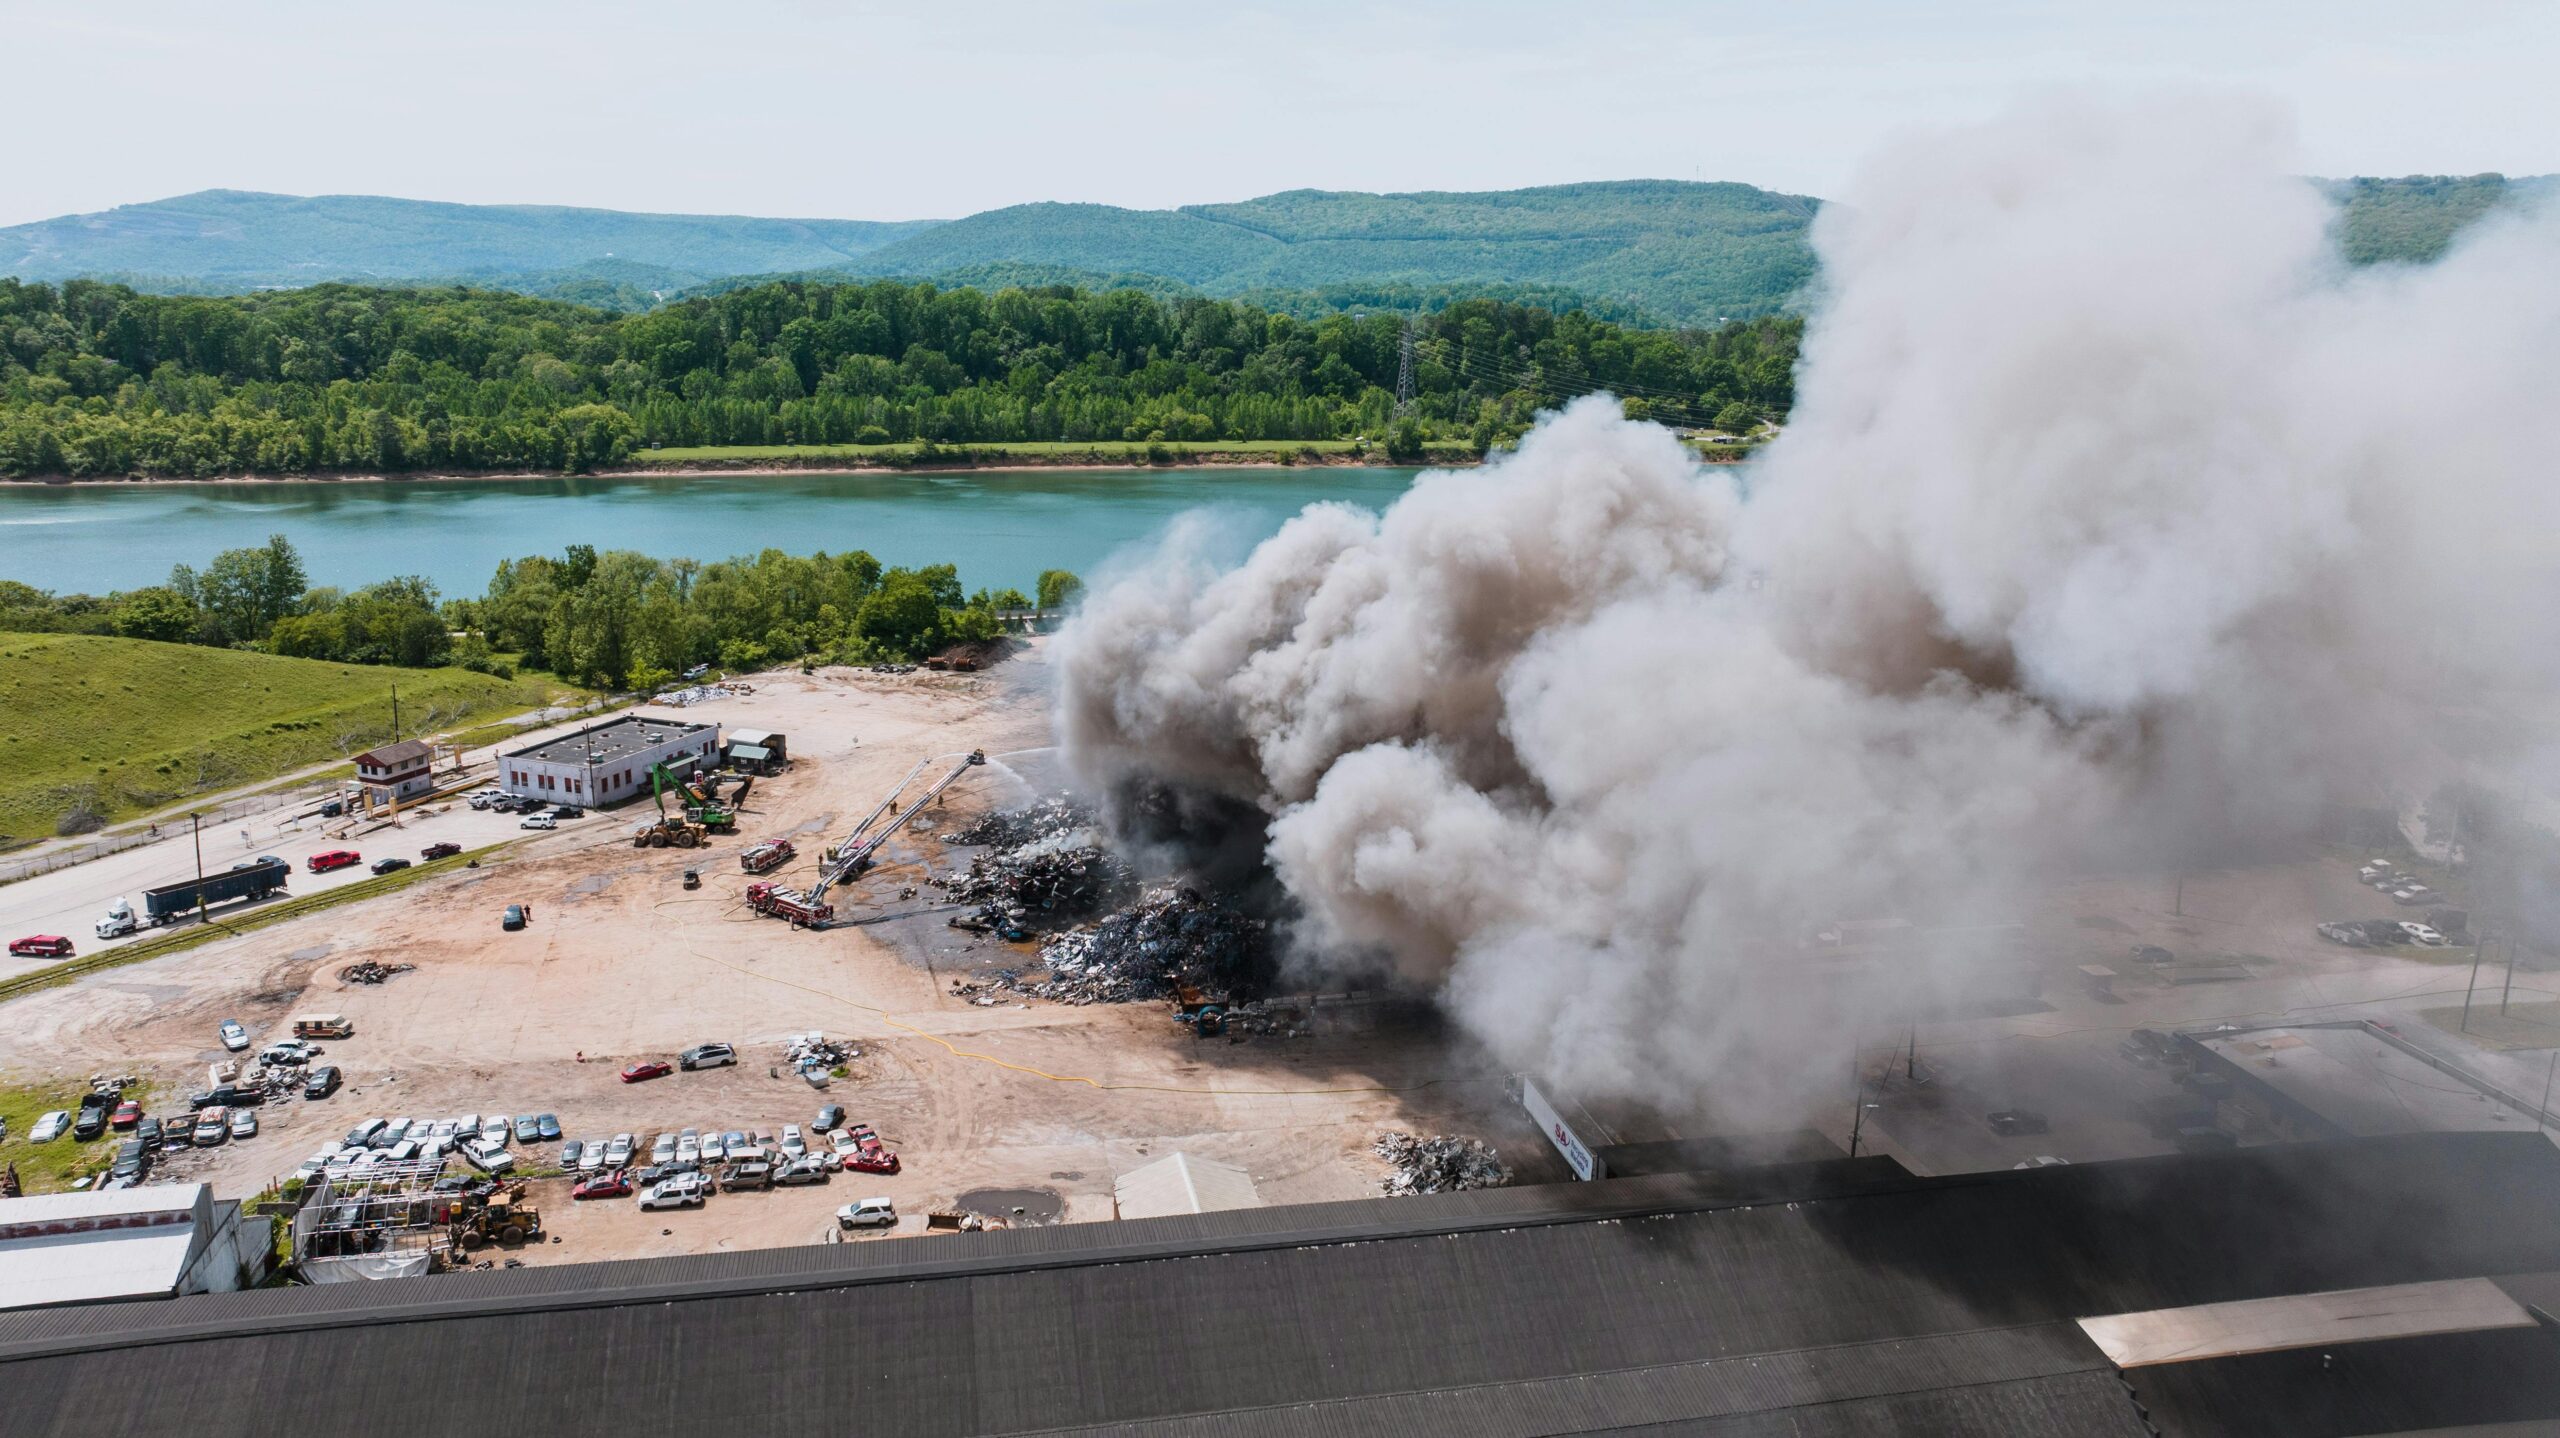
Ember drift simulation represents one of the most challenging aspects of wildfire modeling. These glowing fragments, carried by wind and convection currents, can travel considerable distances from their source, igniting spot fires that dramatically alter fire behavior patterns. The complexity of tracking thousands of individual particles through turbulent atmospheric conditions demands sophisticated computational approaches and equally powerful visualization methods.
Traditional simulation methods often produce overwhelming amounts of data, creating a significant barrier between raw computational output and practical understanding. Without effective visualization, even the most accurate simulations remain trapped in numerical abstracts, inaccessible to decision-makers who need immediate comprehension during critical response situations.
Modern ember drift simulations incorporate multiple physical phenomena: combustion dynamics, aerodynamic forces, thermal degradation, and atmospheric turbulence. Each particle requires tracking through three-dimensional space while accounting for changing wind fields, temperature gradients, and terrain interactions. The resulting datasets contain millions of data points requiring intelligent visualization strategies.
🎨 Essential Visualization Techniques for Particle Systems
Particle-based visualization forms the foundation of ember drift representation. Each ember appears as a discrete entity with properties including position, velocity, temperature, and combustion state. Color mapping techniques transform these properties into visual information, with hot embers rendered in bright yellows and oranges, while cooling particles transition through reds into darker tones before extinguishing.
Trajectory visualization reveals ember travel paths through space and time. Instead of showing only current positions, trajectory lines trace each particle’s journey, creating streamline patterns that illuminate dominant wind patterns and turbulent zones. This temporal dimension proves invaluable for understanding how atmospheric conditions influence ember distribution.
Heat mapping overlays aggregate ember density across spatial regions, highlighting areas with concentrated landing zones. These probability distributions help identify vulnerable structures and vegetation zones most likely to receive ember showers, enabling targeted protection strategies.
Dynamic Temporal Rendering
Time-based animations bring simulations to life, allowing observers to watch ember clouds evolve. Variable playback speeds enable detailed examination of critical moments while rapid scanning reviews overall patterns. Temporal slicing creates snapshot comparisons at specific intervals, facilitating before-and-after analysis of intervention strategies.
Synchronized multi-view displays present simultaneous perspectives: overhead plan views showing spatial distribution, vertical cross-sections revealing altitude stratification, and close-up detailed views examining individual ember behaviors. This multi-scale approach accommodates both strategic planning and tactical decision-making needs.
💡 Advanced Rendering Methods for Enhanced Clarity
Volume rendering techniques transform particle clouds into continuous density fields, creating smooth visual representations of ember concentration gradients. Transfer functions map density values to opacity and color, making dense swarms visually distinct while allowing visibility through sparse regions. This approach reduces visual clutter while maintaining spatial awareness of particle distributions.
Glyph-based visualization represents individual embers with small icons encoding multiple attributes simultaneously. Arrow glyphs indicate velocity direction and magnitude, while size and color convey temperature and mass. Though computationally intensive for large particle counts, glyphs excel in detailed analysis of specific regions or reduced datasets.
Isosurface extraction creates three-dimensional surfaces enclosing regions exceeding specific density thresholds. These boundary surfaces delineate zones of high ember concentration, functioning like weather system boundaries on meteorological maps. Nested isosurfaces at different threshold levels reveal internal structure within ember clouds.
Lighting and Atmospheric Effects
Realistic lighting models enhance spatial perception and aesthetic quality. Emissive lighting from hot particles creates dramatic glowing effects, while ambient and directional lighting improves depth perception. Atmospheric scattering simulations add haze and smoke effects, increasing realism and contextual understanding of fire environments.
Shadow casting from terrain and structures provides critical spatial reference points. Shadows ground floating particles within the landscape, clarifying altitude and position relative to ground features. This seemingly simple addition dramatically improves spatial comprehension, especially in complex topography.
📊 Interactive Visualization for Deep Analysis
Interactive tools transform passive observation into active exploration. Users navigate freely through three-dimensional simulation space, adjusting viewpoints to examine phenomena from optimal angles. Zoom capabilities enable seamless transitions between landscape-scale overviews and individual particle inspections.
Query and filtering systems allow selective visualization of particle subsets based on attribute criteria. Displaying only embers above certain temperatures, within specific altitude ranges, or traveling beyond defined distances isolates phenomena of particular interest. This selective focus reduces cognitive overload while highlighting relevant patterns.
Measurement tools quantify spatial relationships, distances, and concentrations directly within visualization environments. Users draw measurement lines, define analysis volumes, and extract statistical summaries without returning to raw data files. This immediate feedback accelerates understanding and hypothesis testing.
Real-Time Parameter Adjustment
Dynamic parameter controls enable on-the-fly modification of visualization settings without restarting simulations. Adjusting color maps, transparency levels, particle sizes, and display filters provides immediate visual feedback, supporting iterative refinement toward optimal representation for specific analysis goals.
Comparative visualization displays multiple simulation runs simultaneously, revealing how parameter variations affect outcomes. Side-by-side comparisons or difference maps highlighting changes between scenarios support sensitivity analysis and optimization studies.
🗺️ Geospatial Integration for Contextual Understanding
Overlaying ember drift simulations on accurate terrain models grounds abstract particle data in real-world geography. Digital elevation models provide topographic context, showing how terrain features influence wind patterns and ember trajectories. Ridgelines that generate turbulence, valleys channeling winds, and sheltered zones become immediately apparent.
Infrastructure layers add critical context by displaying buildings, roads, power lines, and other assets at risk. Color-coding structures by vulnerability or value focuses attention on protection priorities. Dynamic updates showing structure ignition states throughout simulations reveal attack sequences and timing.
Vegetation maps integrated with ember landing patterns predict ignition probabilities across different fuel types. Dry grasslands, dense forests, and urban landscaping respond differently to ember showers, and visualizing these interactions informs fuel management strategies.
Weather Data Overlay
Wind field visualizations using vector arrows, streamlines, or animated flow textures show atmospheric conditions driving ember transport. Layering wind data over particle positions clarifies cause-and-effect relationships between atmospheric conditions and ember behavior. Time-synchronized updates maintain correlation between changing weather and particle responses.
Temperature and humidity gradients displayed as color-mapped surfaces or contour lines provide additional environmental context affecting ember survival times and ignition potential. Identifying regions where atmospheric conditions support long-distance ember transport versus rapid extinction guides resource allocation.
🔬 Validation and Verification Visualization
Comparing simulation outputs against observational data validates model accuracy. Overlay displays superimpose actual spot fire locations recorded during real events over simulated ember landing zones, revealing agreements and discrepancies. Quantitative metrics like distance errors and probability accuracy scores supplement visual comparisons.
Uncertainty visualization communicates confidence levels in simulation predictions. Ensemble simulations with varied initial conditions generate probability distributions visualized through opacity gradients, contour bands, or error bars. Regions with high agreement across ensemble members appear solid and definite, while uncertain areas display visual ambiguity reflecting predictive uncertainty.
Residual plots showing differences between simulated and observed values highlight systematic biases and random errors. Spatial patterns in residuals indicate model deficiencies requiring attention, guiding iterative model improvements.
🎯 Specialized Visualization for Operational Applications
Emergency response visualization prioritizes immediate actionable information over comprehensive detail. Simplified displays emphasize critical threats, predicted structure exposures, and evacuation route safety. Color-coded threat levels—green for safe, yellow for caution, red for danger—enable rapid situation assessment by personnel without technical expertise.
Decision support interfaces integrate ember drift visualizations with resource allocation tools. Displaying suppression assets alongside predicted ember attack zones facilitates optimal positioning and deployment timing. Route planning overlays show safe access corridors and identify roads likely blocked by spot fires.
Public communication visualizations translate technical simulation outputs into understandable formats for community education and warning systems. Animated maps showing potential ember impacts help residents understand personal risk and appropriate protective actions. Simplified graphics suitable for mobile devices and emergency alerts expand reach during active events.
Training and Education Tools
Interactive educational visualizations support firefighter training and public awareness programs. Scenario-based simulations demonstrate how different conditions affect ember behavior, building intuitive understanding of fire physics. Gamified interfaces engage learners while conveying serious safety information.
Virtual reality implementations provide immersive experiences, placing users inside ember storm environments. This first-person perspective builds emotional understanding and situational awareness impossible through traditional displays. VR training scenarios prepare responders for high-stress conditions in safe environments.
⚙️ Technical Implementation Considerations
Performance optimization ensures visualization keeps pace with simulation outputs, particularly for real-time operational applications. Level-of-detail techniques render distant particles with reduced complexity while maintaining full detail for nearby features. Culling algorithms eliminate particles outside viewing frustums, reducing computational load.
Hardware acceleration through GPU computing offloads visualization calculations from central processors to graphics cards optimized for parallel operations. Modern graphics APIs provide efficient particle rendering pipelines handling millions of elements at interactive frame rates.
Data management strategies address the challenge of massive simulation datasets. Progressive loading streams data incrementally, displaying coarse representations immediately while refining detail as additional data loads. Compression techniques reduce storage and transmission requirements without sacrificing essential information.
Rendering Pipeline Architecture
Modular visualization architectures separate data ingestion, processing, rendering, and interaction components. This separation enables flexible configuration, supporting diverse hardware platforms from high-end workstations to mobile devices. Cloud-based rendering services distribute computational demands, making advanced visualizations accessible without specialized local hardware.
Standardized data formats facilitate interoperability between simulation engines and visualization tools. Domain-specific formats optimized for particle data ensure efficient storage and rapid access. Metadata standards document simulation parameters, coordinate systems, and units, preventing interpretation errors.
🚀 Emerging Technologies and Future Directions
Artificial intelligence integration promises intelligent visualization adaptation. Machine learning algorithms analyze user interactions, automatically adjusting display parameters toward optimal configurations for specific tasks. AI-powered anomaly detection highlights unusual patterns deserving attention, acting as intelligent visualization assistants.
Augmented reality overlays simulation predictions onto actual landscapes viewed through mobile devices or heads-up displays. Firefighters on the ground see predicted ember trajectories superimposed on their actual surroundings, merging digital predictions with physical reality for enhanced situational awareness.
Collaborative visualization environments enable distributed teams to explore simulations simultaneously from different locations. Shared virtual spaces support coordinated analysis and planning, with participants manipulating views and highlighting features visible to all team members. This collaborative approach leverages diverse expertise regardless of geographic separation.
🌟 Maximizing Visualization Impact Through Design Principles
Effective visualization balances information density with clarity. Overcrowded displays overwhelm viewers while sparse presentations waste screen real estate. Iterative testing with representative users identifies optimal information levels for different audiences and purposes.
Consistent visual language across related displays reduces cognitive load. Standardized color schemes, icon sets, and interaction patterns enable users to transfer knowledge between different visualization types. Documentation and legends ensure unambiguous interpretation.
Accessibility considerations ensure visualizations serve diverse users including those with color vision deficiencies. Color schemes selected for perceptual uniformity and distinguishability by colorblind users expand usability. Alternative encoding methods supplement color with texture, size, or pattern variations.
Regular evaluation and refinement through user feedback drives continuous improvement. Observing how practitioners actually use visualizations reveals misunderstandings, inefficiencies, and unmet needs. Iterative design cycles incorporating lessons learned steadily enhance effectiveness.
🎓 Building Expertise in Visualization Development
Mastering ember drift visualization requires interdisciplinary knowledge spanning fire science, computational methods, human perception, and software engineering. Formal education in scientific visualization provides foundational principles, while domain-specific expertise ensures accurate representation of fire physics.
Practical experience through project-based learning accelerates skill development. Working with real simulation datasets, receiving feedback from domain experts, and observing visualization applications in operational contexts build intuition impossible to gain from theoretical study alone.
Community engagement through conferences, workshops, and collaborative research projects connects practitioners, facilitates knowledge exchange, and drives collective advancement. Open-source visualization tools and shared datasets lower barriers to entry, democratizing access to sophisticated capabilities.
The journey toward visualization mastery proves as dynamic as the ember drifts being modeled. Continuous learning, experimentation with emerging technologies, and commitment to user-centered design principles separate adequate visualizations from truly transformative tools that unlock simulation potential for enhanced safety and understanding.